Learn about influence FM’s Reports
Available Reports for Managers in influenceFM
(Daily activity reports run at 3:00 AM Pacific time.)
The following are 8 detailed reports available for managers:
- Projections
- Collections
- Projected Sales
- Annual Budgets
- Friday Reports
- Sales Force Activity
- Leaderboard
- TeleProspecting
(see image below)
Projections (click to open)
Projections
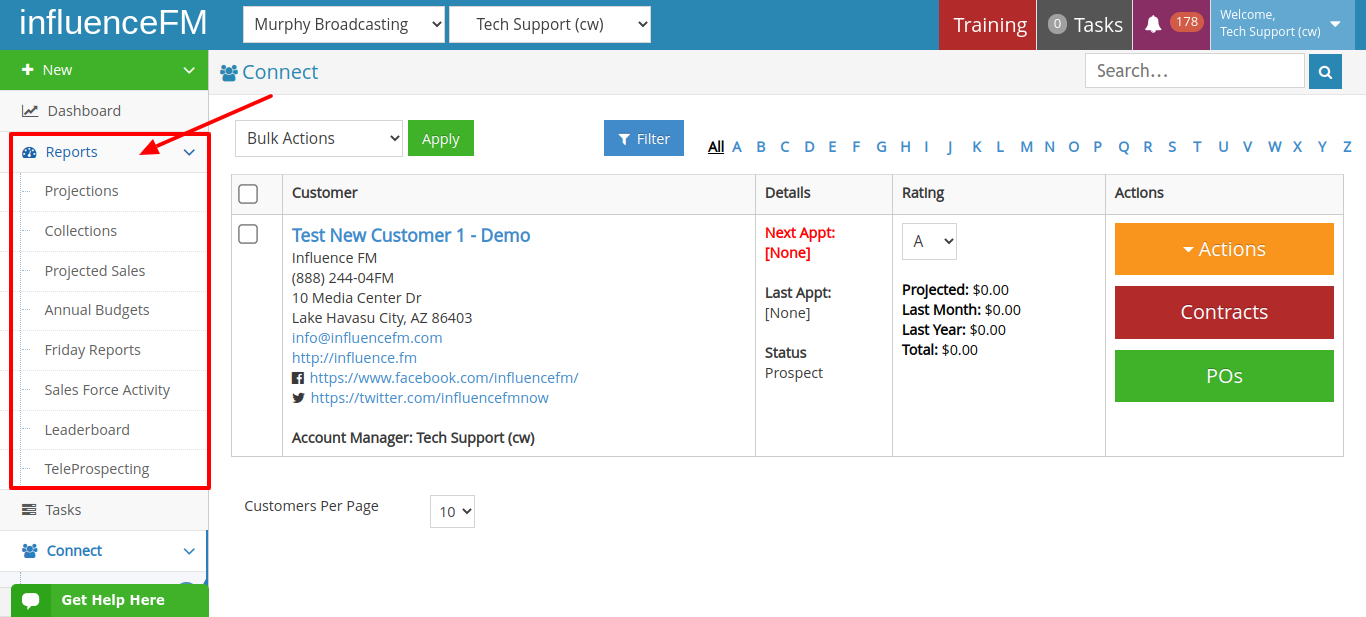
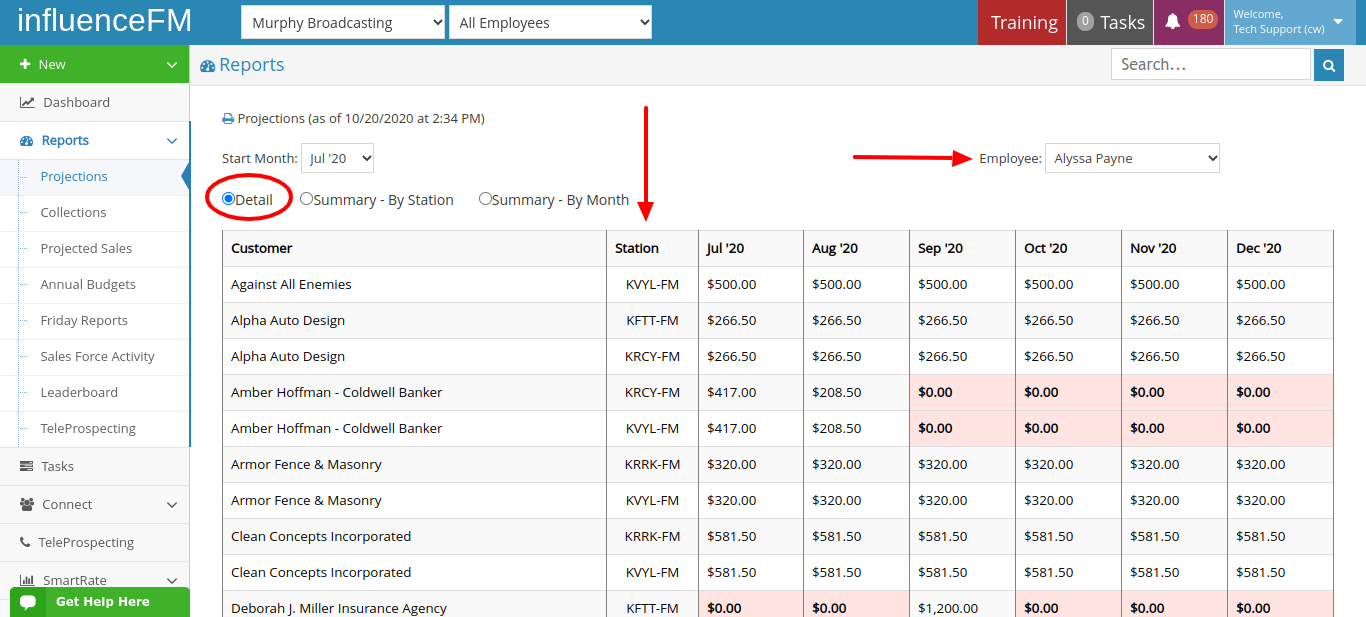
Click on “Reports” on the left side of your screen and then select “Projections” from the drop-down menu.
Below are options you will find on the “Projections” page:
Detail: this shows what station each customer is running on and projected sales per month by employee. Choose the employee you would like to see the projected details for. (see image below)
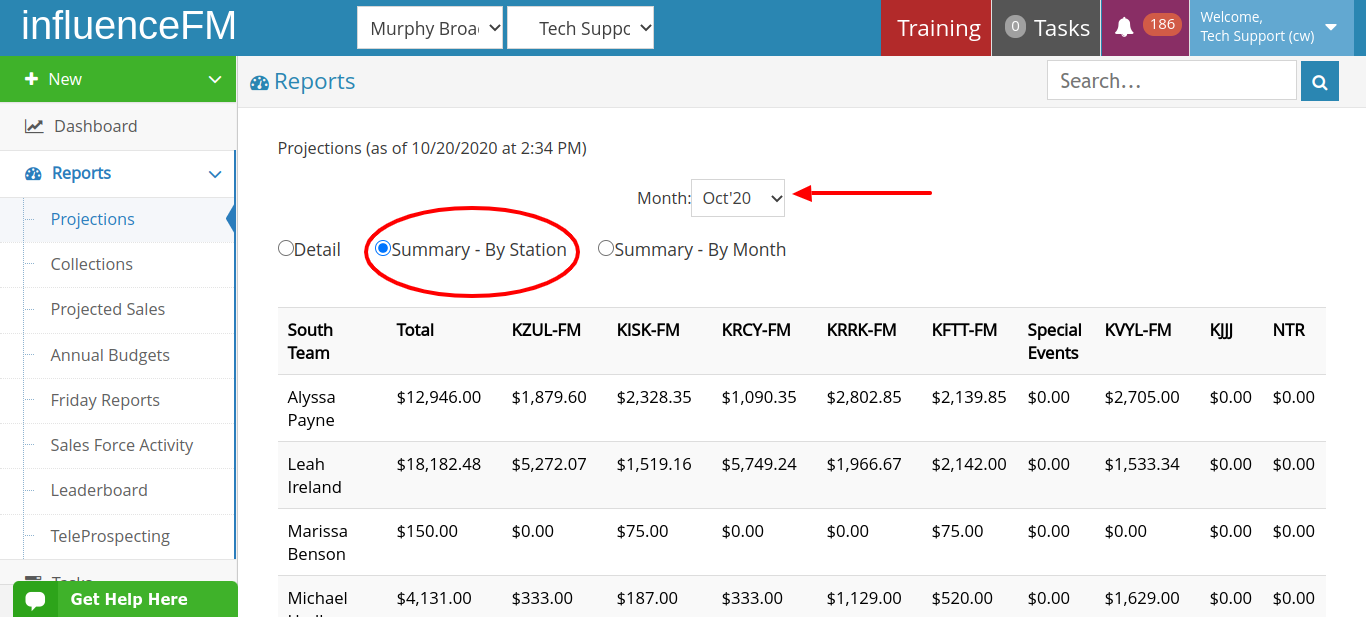
Summary – By Station: This report shows a summary of projected sales broken down by station per month. (see image below)
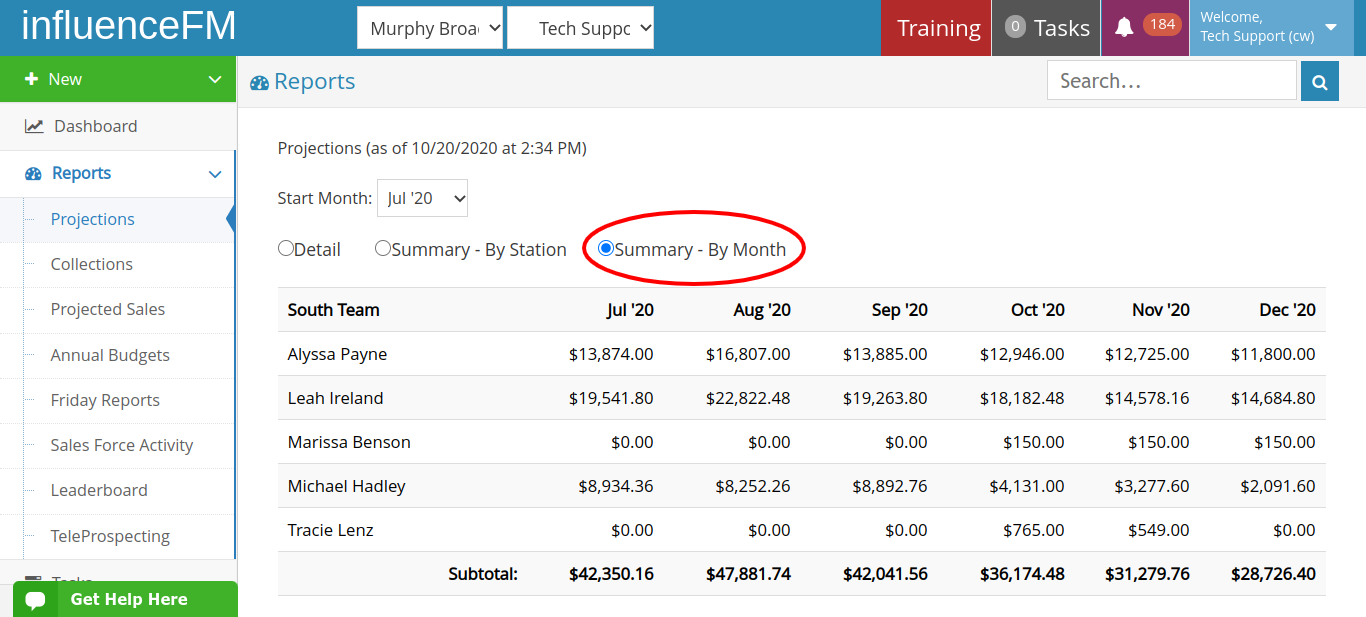
Summary – By Month: This is a breakdown of the projected sales by each rep per month. (see image below)
Collections (click to open)
Collections
Click on “Reports” on the left side of your screen and then click on “Collections” from the drop-down menu.
Below are the options that you will find on the “Collections” page:
Detail: Here you can view information on collections by an individual reps customer list.
Summary: This is a summary of collections imported from Traffic showing sales reps that have a customer in collections.
Projected Sales (click to open)
Projected Sales
Click on the “Reports” button on the left side of your screen and then select “Projected Sales”
Projected Sales are numbers based off the appointments and customers the reps enter in their calendar.
Choose your desired date range. The default range is the current week you are in.
This report shows: Has CNA, Non-Cash (Trade), On-Air, Closings and Contract Value
This report can be printed or exported to XML, CSV or Excel by clicking on the little floppy disk icon circled in red below.
(see image below) 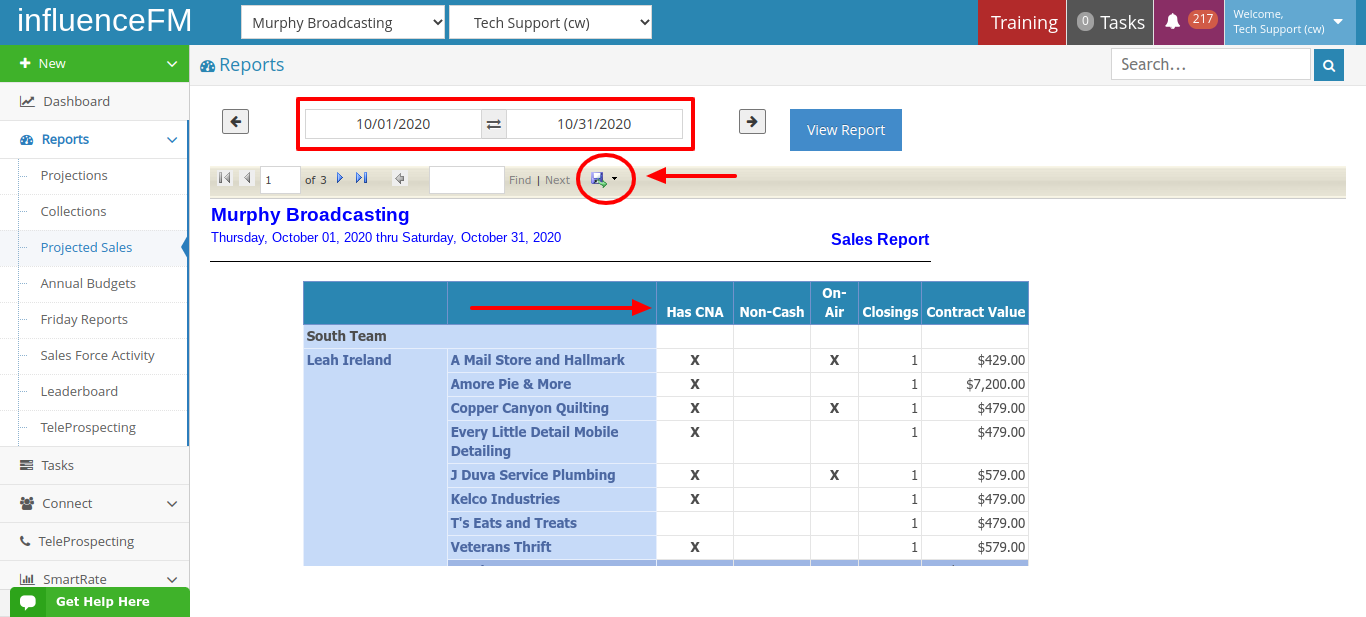
Annual Budgets (click to open)
Annual Budgets
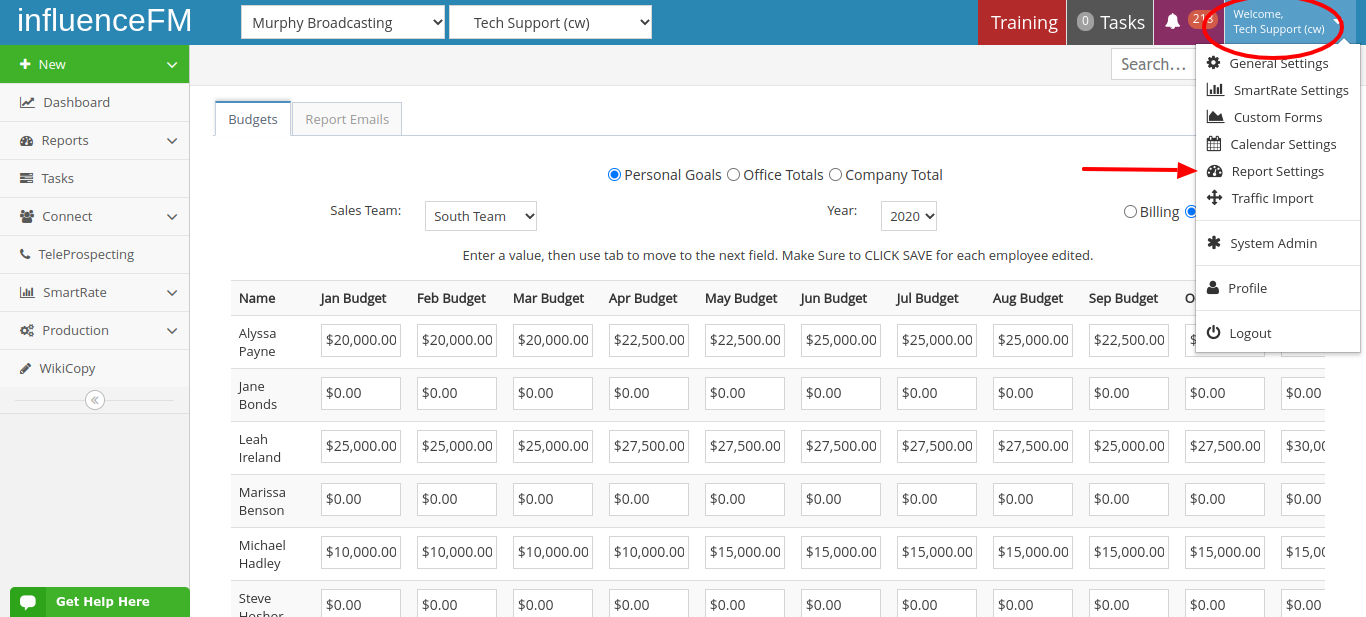
Click on the “Reports” button on the left side of your screen and then select “Annual Budgets”
Annual Budgets are based off the budgets entered into the system by the manager divided by what the actual sales were by each individual sales reps for the year broken down by month. (see image below)
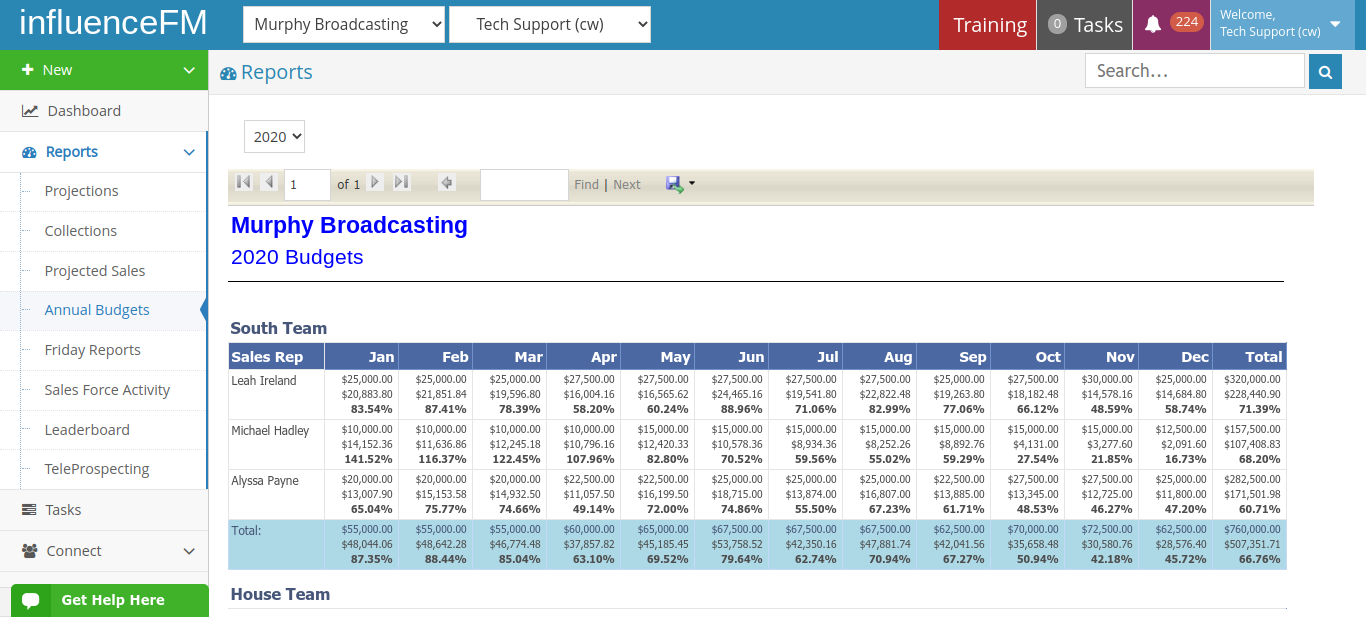
For more information on setting up budgets in influenceFM, please refer to the “(For Managers) Reports Settings” training module in the Settings button under Management Training. (see image below)
Friday Reports (click to open)
Friday Reports
Click on the “Reports” button on the left side of your screen and then select “Friday Reports”
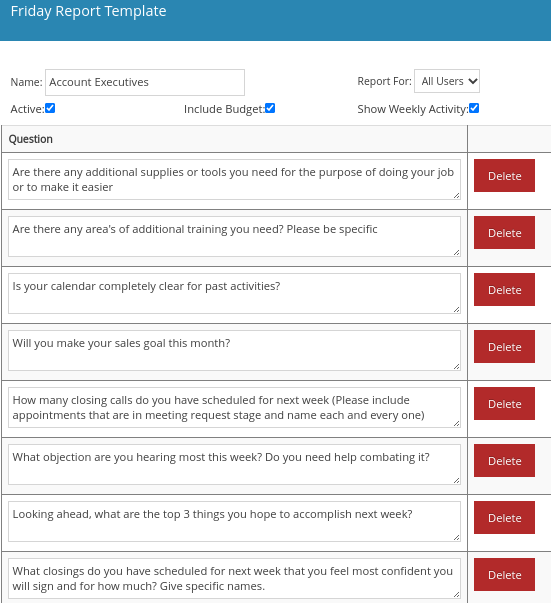
Friday Reports are comprised of significant questions to ensure that each individual employee has all of the training, tools and resources they need to function in a healthy working environment. This report goes out to employees every Friday, ensuring that all of their needs to function at the highest performance, are being met.
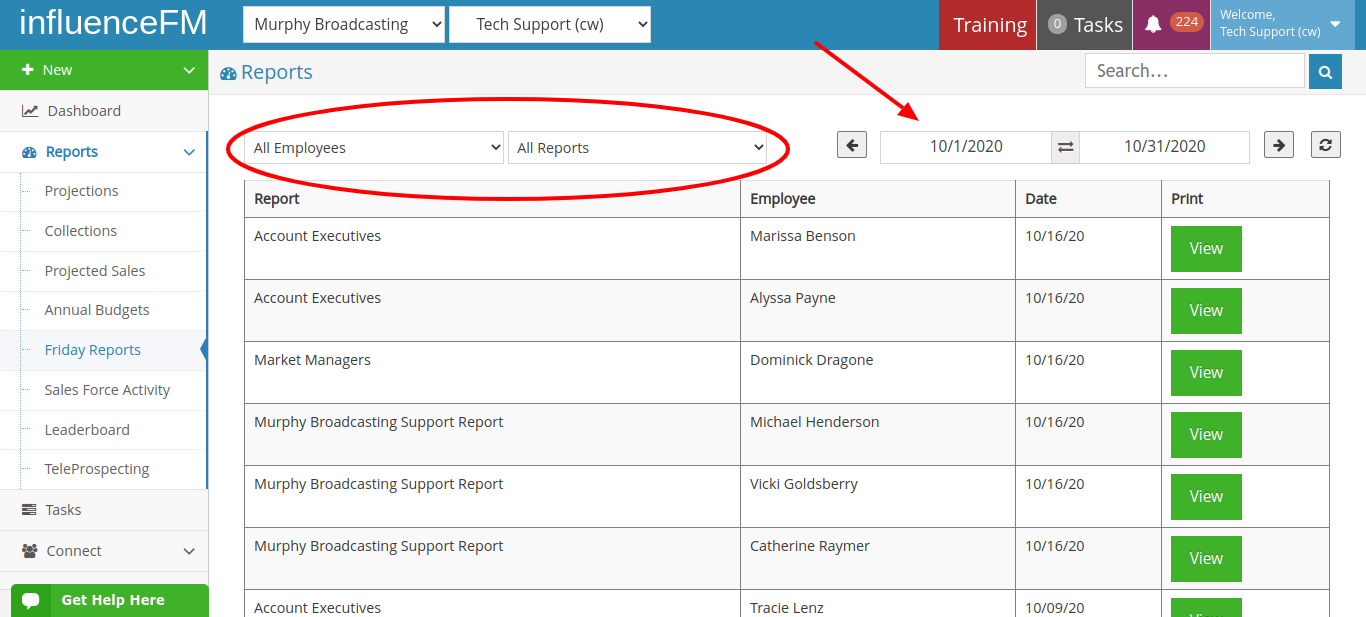
There are different report questions asked pertaining to each staff members job position. All of the questions are completely customizable and changeable.
Below is an example of questions being asked to staff members in a Friday Report. (see image below)
Sales Force Activity (click to open)
Sales force Activity:
Click on the “Reports” button on the left side of your screen and then select “Sales Force Activity”
Below are the tabs you will find in the “Sales Force Activity” page:

 Click on the question mark icon to get more information for the columns under the Sales, Tasks and Calendar Detail tabs.
Sales: Here you can view information on sales by teams and by each sales rep
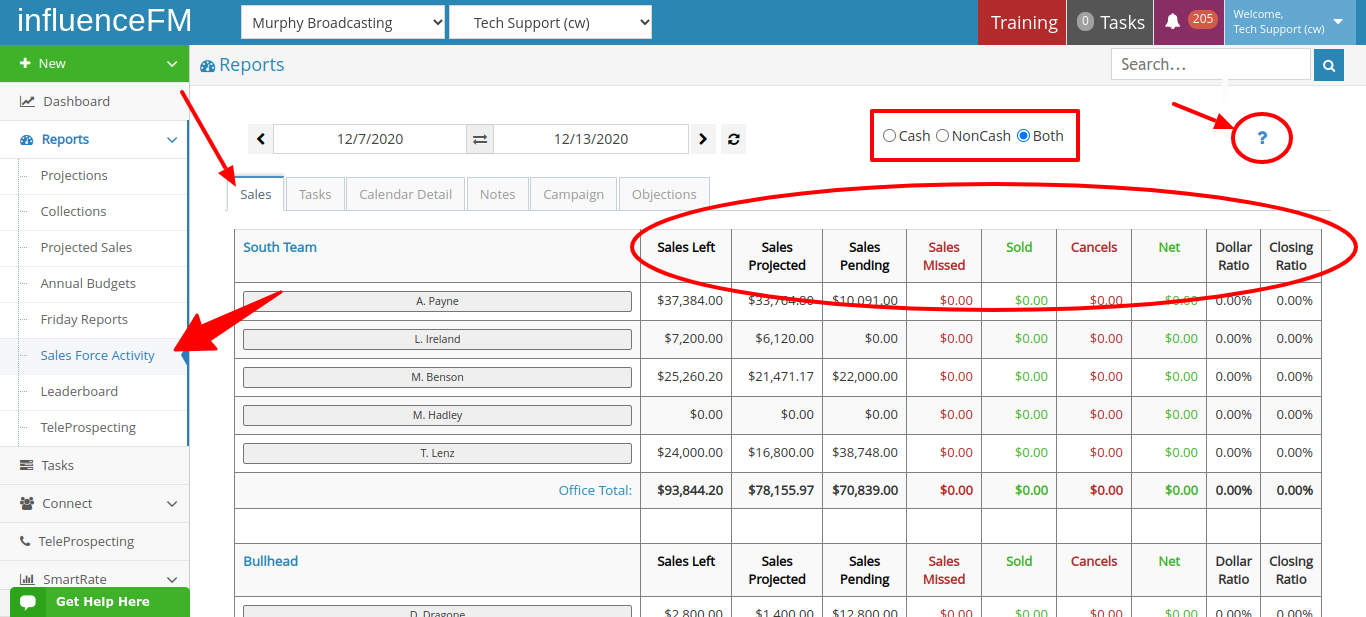
If you click on the reps name you will be able to see a more detailed view of their work
-
SALES LEFT – Items that have been marked by a sales rep as a closing. The system adds up the dollar amount for each scheduled closing for the time period selected.
-
SALES PROJECTED – The average amount of dollars that are expected to close. The system adds up the dollar amount times confidence for each scheduled closing.
-
SALES PENDING – Items that have marked by a sales rep as a follow up closing call.
-
SALES MISSED – Closings that were completed but no sale occurred, for the time period selected.
-
SOLD – Any closing that was completed with a sale occurring, for the time period selected.
-
CANCELS – Any cancellations processed for the time period selected.
-
NET – Sales minus Cancellations.
-
DOLLAR RATIO – The percentage of dollars received compared to the amount of dollars that were asked for.
-
CLOSING RATIO – The percentage of closing calls that have become contracts.
Tasks: This will show information on Cold Calls, CNAs, Presentations, Closings, Follow-up Closings and Contracts for each sales rep. External Tasks entered on the calendar will not show on reports. (be careful not to enter an appointment as a task)
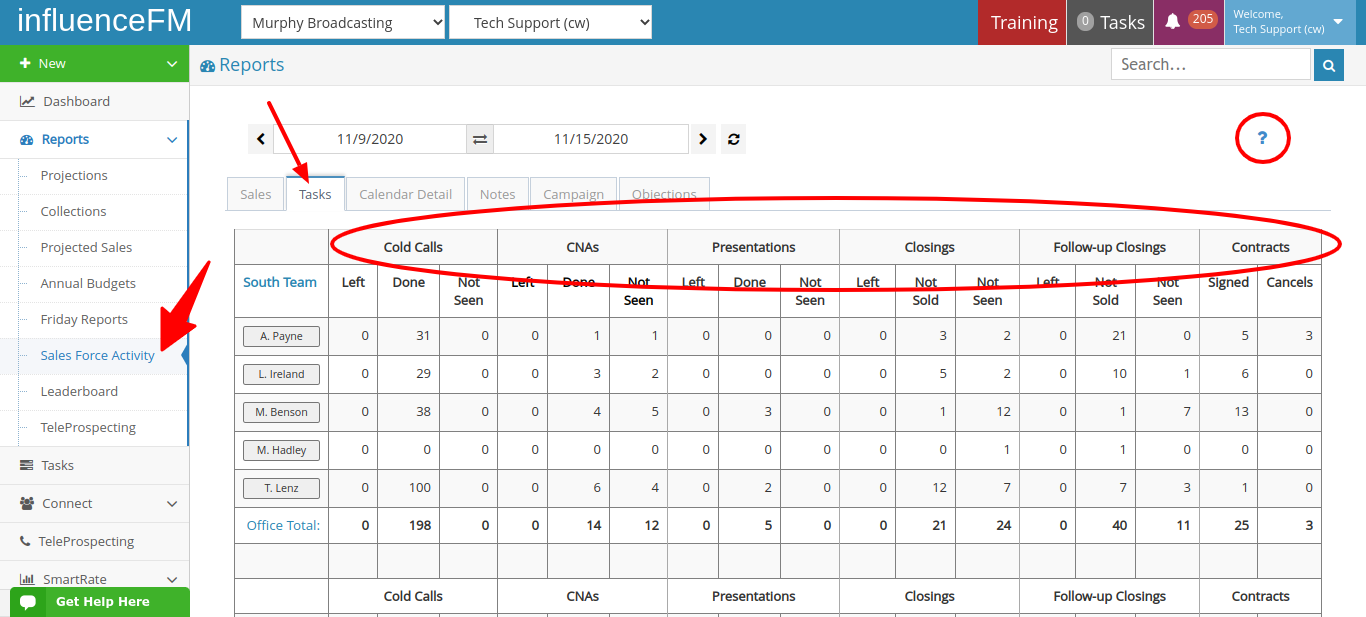
-
LEFT – Activities that are scheduled but have not yet been marked complete for the time period selected.
-
DONE – Activities that have been marked complete.
-
NOT SEEN – The client was not seen on the scheduled appointment
-
CLOSINGS NOT SOLD – The contract was not signed by the client.
-
CLOSINGS NOT SEEN – The client was not seen on the scheduled appointment.
-
CONTRACTS SIGNED – The number of contracts signed for the time period selected.
-
CONTRACTS CANCELLED – The number of contracts cancelled for the time period selected.
Calendar Detail: This is a breakdown of the reps calendar that shows you Customers Name, Type, $ Presented, Sold, Cancelled and Date
In the “All Types” field drop down menu, you will be able to sort by the specific different concerning types that are happening with that customer. For Example: you can choose to sort by CLOSING: Annual, Meeting Request Followup Closing, Copy Call, CNA along with many other additional choices to sort by.
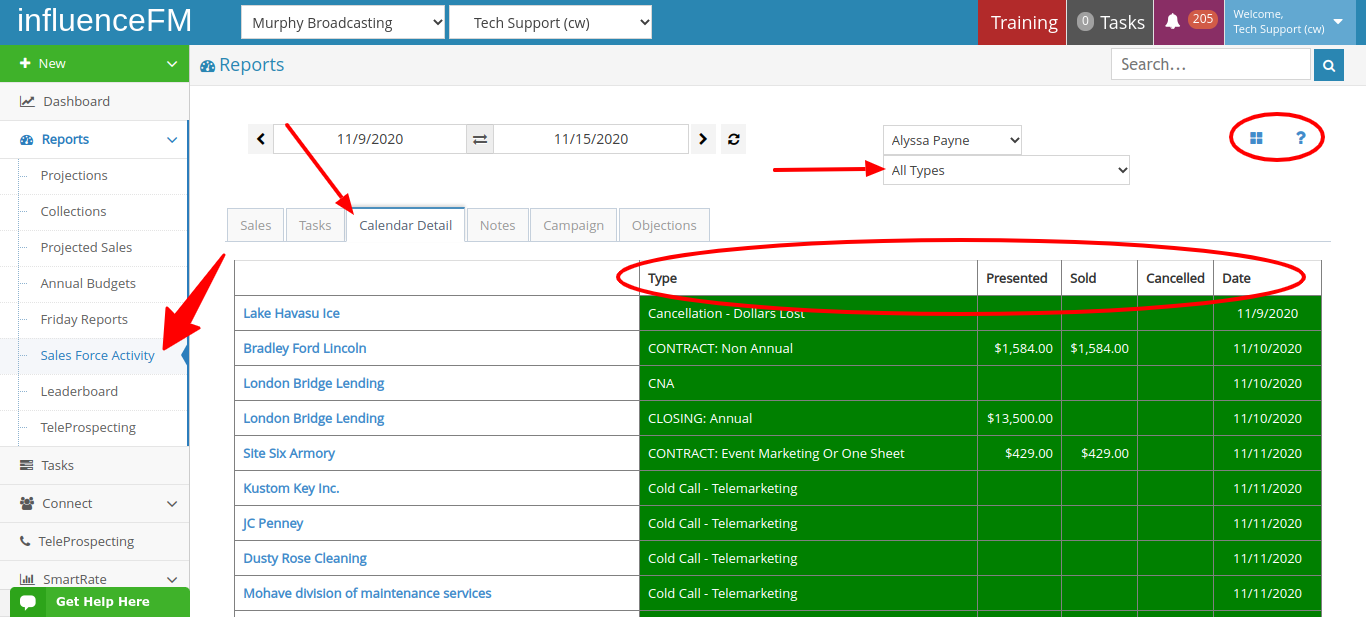
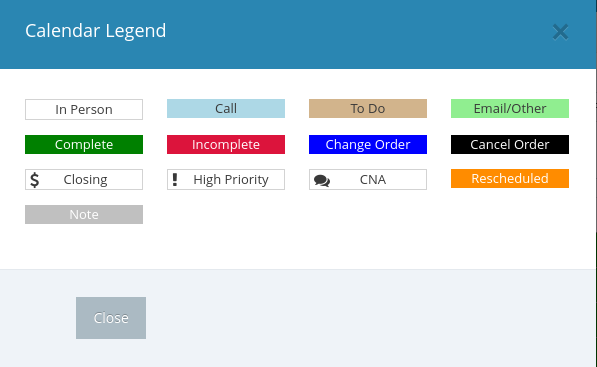
![]() Calendar Legend Icon: if you click on these 4 blue squares, it opens the calendar legend to see what each color and symbol signifies.
Calendar Legend Icon: if you click on these 4 blue squares, it opens the calendar legend to see what each color and symbol signifies.
-
CUSTOMER – The customer seen on the appointment, as scheduled by the Sales Rep. Click the name to view the appointment details as scheduled by the Sales Rep.
-
TYPE – The appointment type as scheduled by the sales rep.
-
PRESENTED – The dollar amount of the contract presented to the customer by the sales rep.
-
SOLD – The dollar amount of the signed contract.
-
CANCELLED – The dollar amount of a cancelled contract.
-
DATE – The date of the activity, as scheduled by the sales rep.
Notes: Enter your notes under this tab
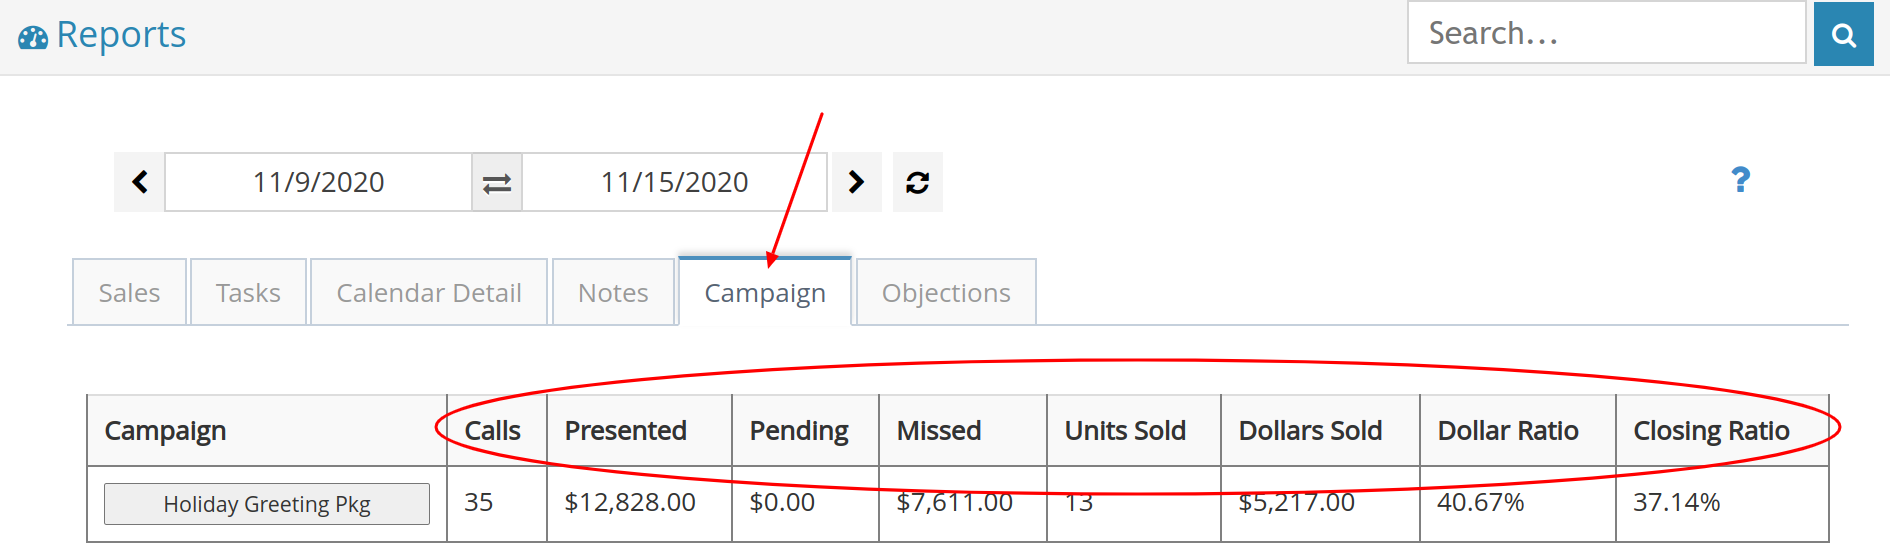
Campaign: This is where you can check to see how your campaigns are doing
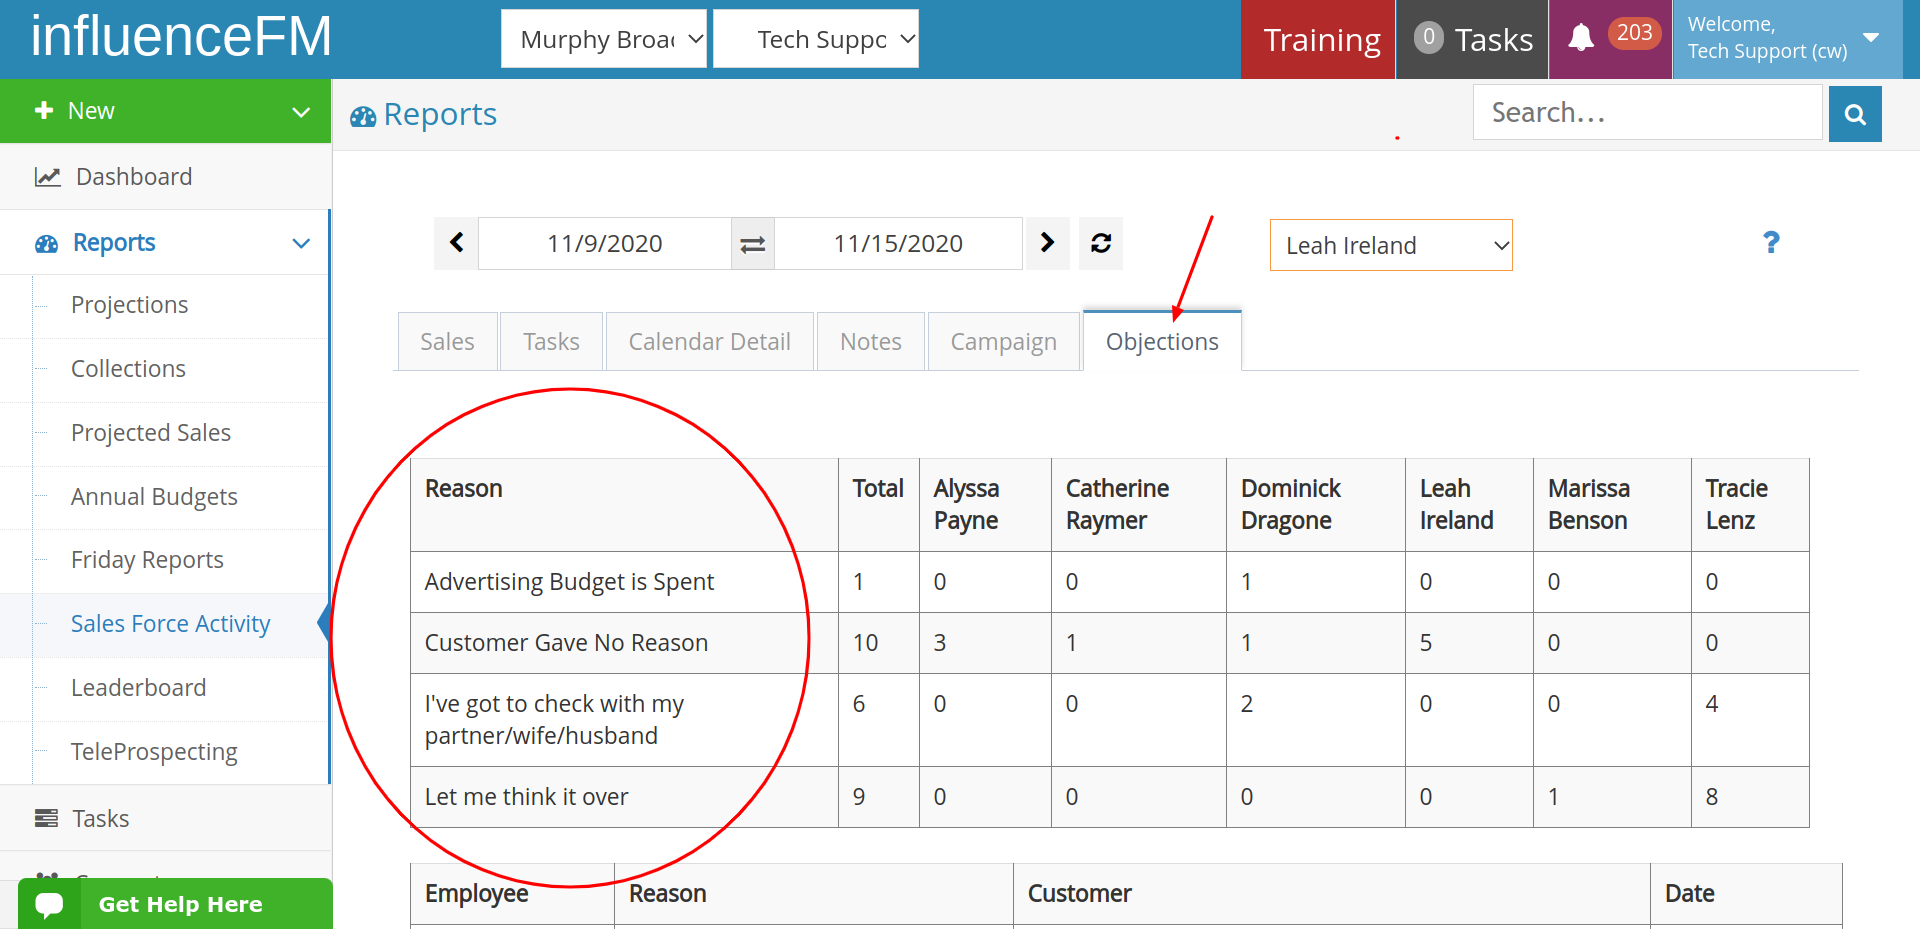
Objections: If a rep is often getting the same objection, you will be able to see that in this tab. This will give you extra insight so you are able to meet with your rep and give them better training towards that sort of objection. Click on this link for great sales tools and tips for overcoming objections.
Leaderboard (click to open)
Click on the “Reports” button on the left side of your screen and then select “Leaderboard”
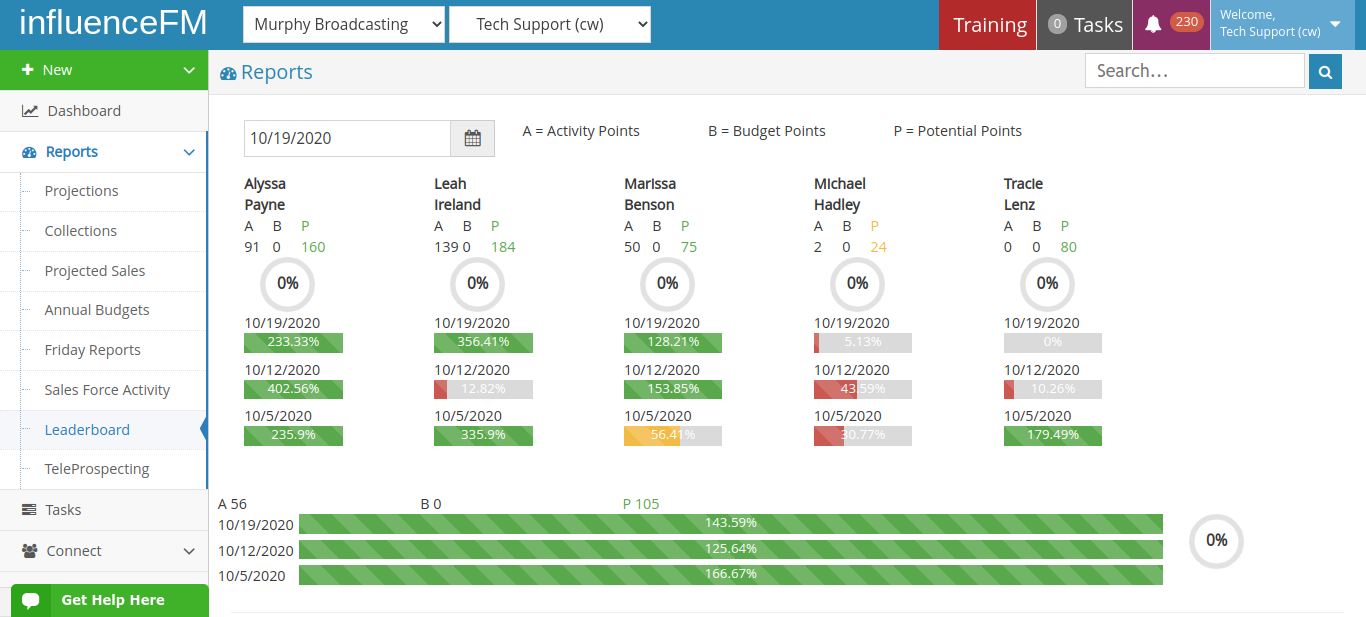
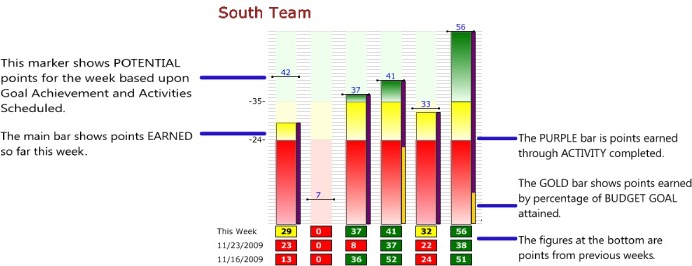
Leaderboard: The leaderboard is broken down by the week and rates by rep on multiple points. These include A=Activity Points, B=Budget Points and P=Potential Points. You want to focus on them being in green. If you scroll down the screen, there is an overall rating for each office.
TeleProspesting (click to open)
TeleProspecting
Click on the “Reports” button on the left side of your screen and then select “TeleProspecting”
Below are the tabs you will find on the “TeleProspecting” report page:
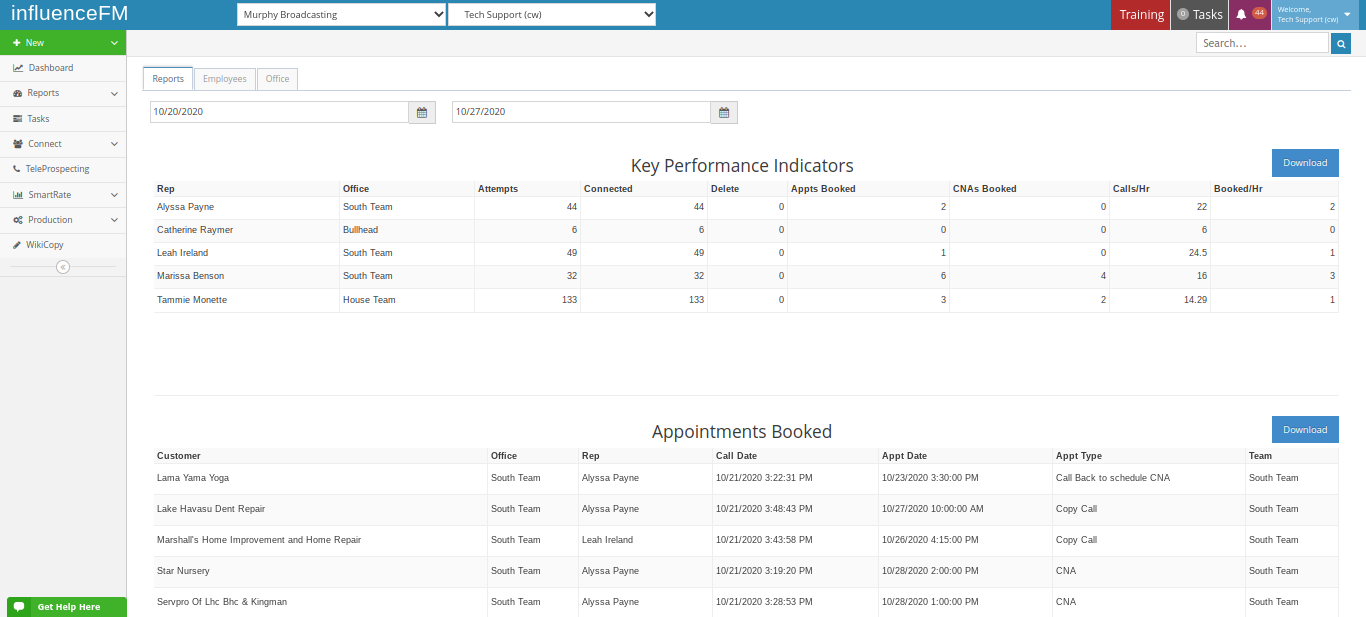
Key Performance Indicators: this 1st section on the report shows how many attempted calls the rep made, how many of those calls the rep connected with, how many were deleted, how many appointments were booked, CNA’s booked, calls per hour and appointments booked per hour.
Appointments Booked: the 2nd section on the report shows what customer got an appointment booked, the call date, appointment date, appointment type and what rep and from what team booked that appointment.
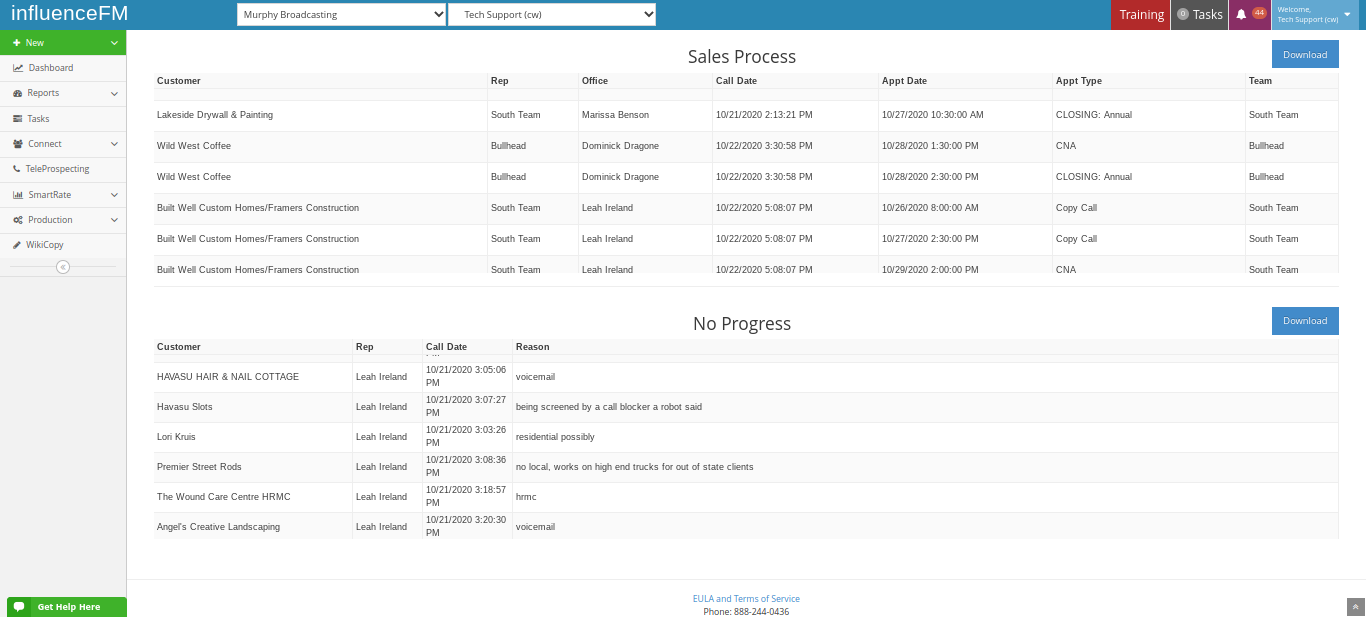
Sales Process: the 3rd section on the report shows what step in the sales process the customer is in like; scheduling a CNA, if there is a closing call, or if there is a copy call.
No Progress: the 4th and last section shows if there has been no progress with that potential customer and shows the reason why there has been no progress.
(See images below)